A rain gauge, also known as a rain meter or rain gauge, is an instrument used by meteorologists and hydrologists to measure the amount of rainfall over a period of time. Most rain gauges measure in millimeters. Rainfall is sometimes reported in centimeters or inches.
1. What is the water of the earth? – The indispensable importance of water
- Water – the primary reason for life on Earth – is constantly circulating through one of Earth’s most powerful systems: the water cycle.
- Water flows endlessly between the ocean, atmosphere and land.
- Water on Earth is finite, meaning the amount of water in, on, and above our planet is neither increasing nor decreasing.
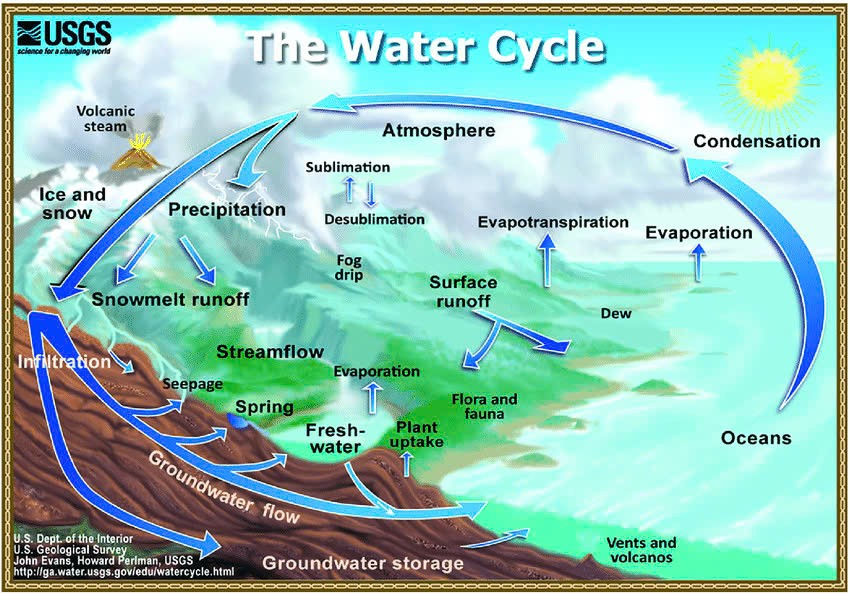
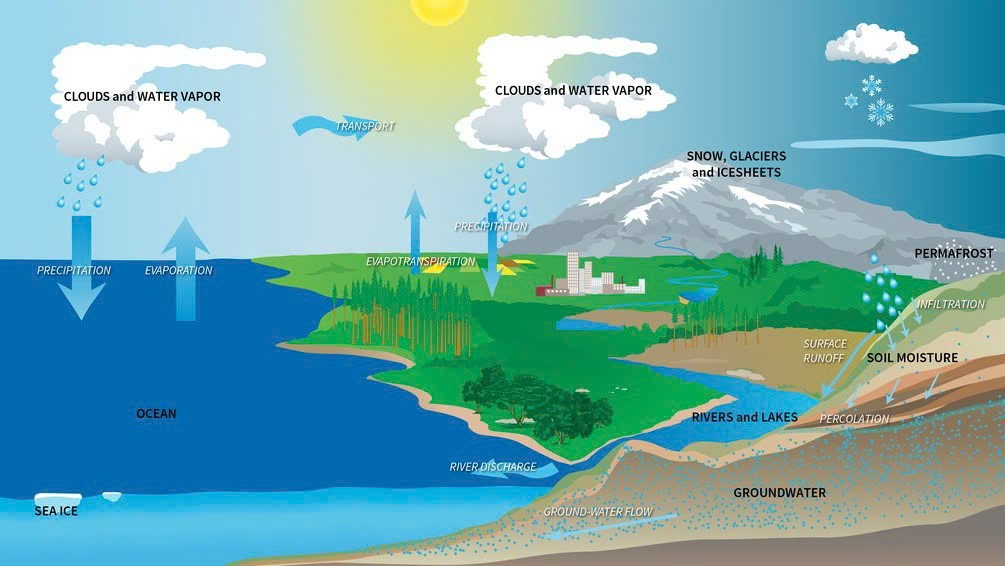
What is the Water Cycle?
The water cycle describes how water evaporates from the Earth’s surface, rises into the atmosphere, cools, condenses to form clouds, and falls back to the surface as precipitation. About 75% of the energy (or heat) in the global atmosphere is transferred through the evaporation of water from the Earth’s surface.
- On land, water evaporates from the ground, mainly from soil, plants (i.e. transpiration), lakes and streams.
- In fact, about 15% of the water that enters the atmosphere comes from evaporation from the Earth’s surface and transpiration from plants.
- Such evaporation cools the Earth’s surface, cooling the lower atmosphere and supplying water to the atmosphere to form clouds.
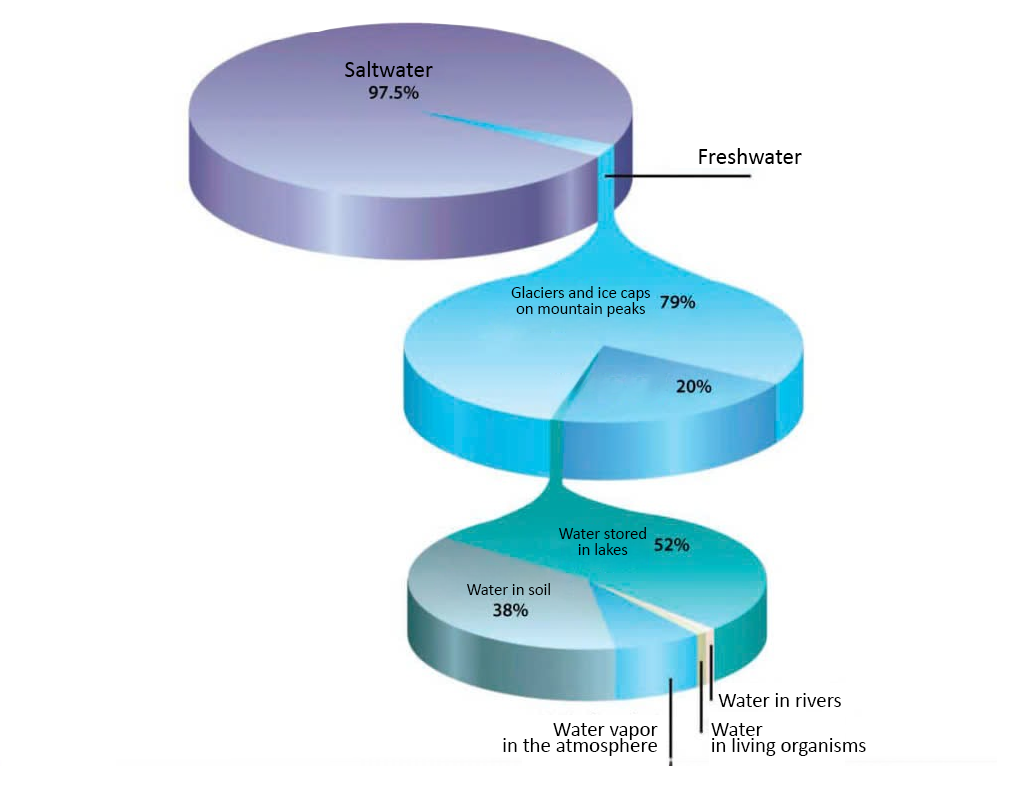
Fresh water of the earth
- Of all the water that exists on our planet, about 97% is salt water and less than 3% is fresh water.
- Most of the fresh water on Earth is frozen in glaciers, ice caps, or deep underground in aquifers.
- Less than 1% of the Earth’s water is freshwater that we can easily access to meet our needs, and most of that water is replenished by rainfall – a vital component of the water cycle, which affects every living thing on Earth.
Rainfall
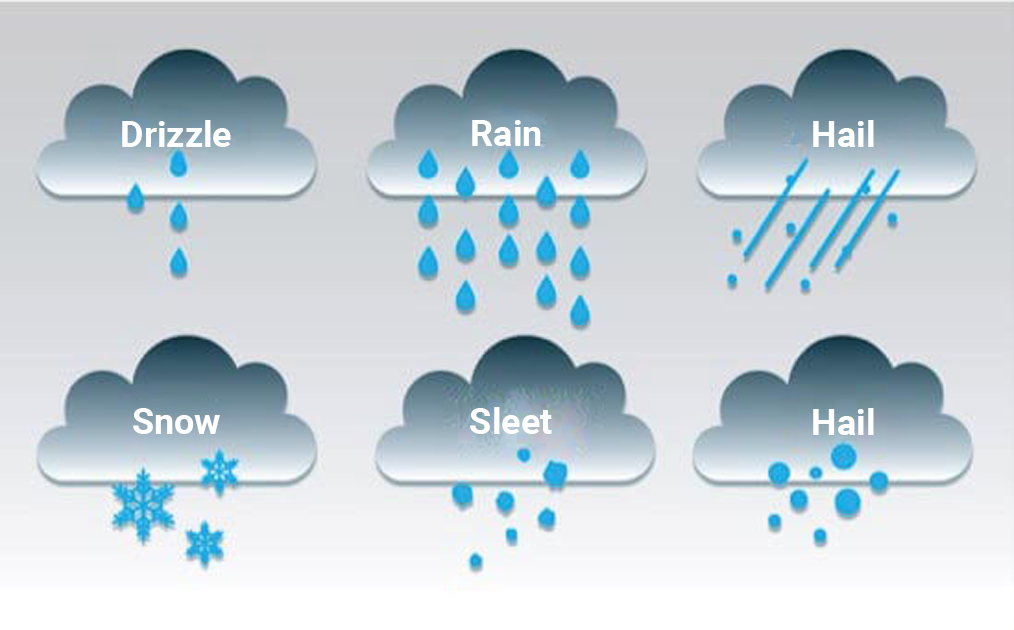
Precipitation is any product of condensation of water vapor in the atmosphere that falls rapidly from a cloud. Major forms of precipitation include drizzle, rain, hail, snow, graupel (soft hail or snow pellets), and hail. Precipitation is any product of condensation of water vapor in the atmosphere that falls rapidly from a cloud.
The main forms of precipitation include:
- Drizzle
- Rain
- Hail
- Snow
- Graupel (soft hail or snow)
2. Measuring Rainfall: On the Ground and from Space
Today, scientists can measure rainfall directly—using ground-based instruments such as rain gauges—or indirectly—using remote sensing techniques (e.g., from radar systems, aircraft, and Earth-observing satellites).
Measuring Rainfall with a Rain Gauge
- Rain gauges measure rainfall at a given location. Typically, measurements from an individual rain gauge are used to represent rainfall over larger areas, i.e. between measuring points.
- However, that’s not always the best assumption. The reality is that more or less rain may fall at the location of the gauge — or it may not fall at all. A broken gauge, obstructions around the gauge, or even strong winds can cause errors in the reading.
- A faulty meter or obstructions around the meter or even strong winds can cause measurement errors.
3. Applications of Rainfall Data in some real life examples
Humans are directly affected by changes in rainfall on a variety of scales. For example, increased rainfall can cause flooding and/or landslides that affect individual homes, cities, or even entire countries.
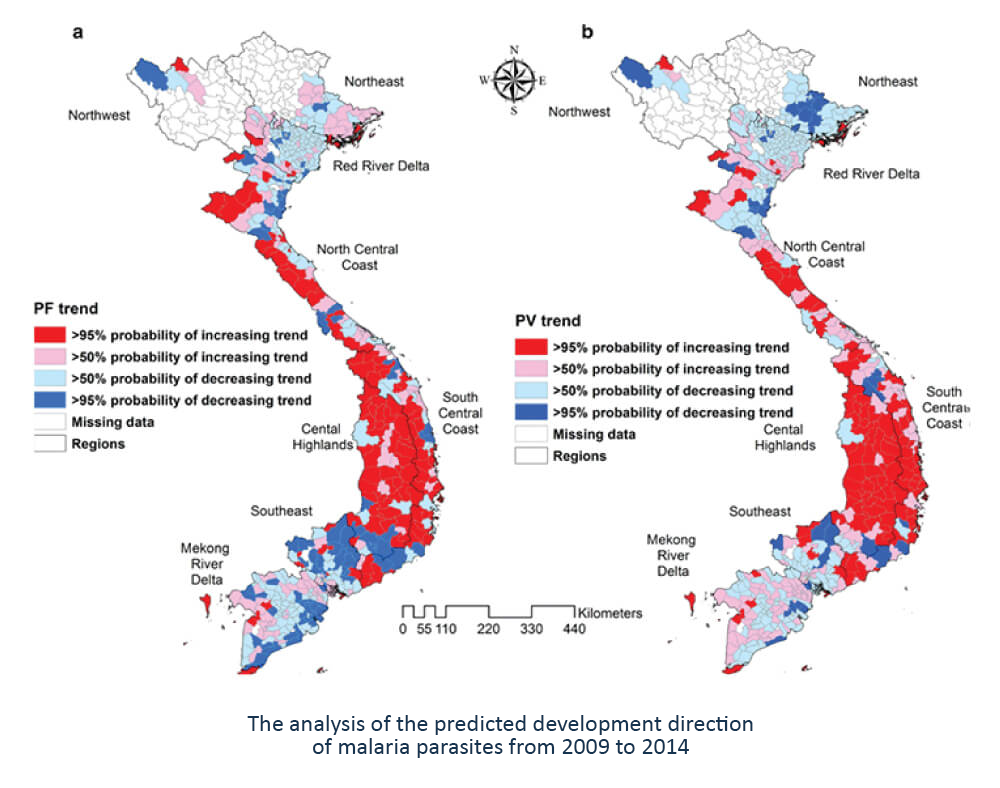
- Natural disaster impact: Flooding and torrential rainfall can also have negative health impacts, such as increasing the spread of diseases like malaria.
- Drought & wildfires: Drought conditions can affect an area’s wildfire rate or reduce crop yields for local farmers — both of which can have major impacts on local and regional economies.
- Urgent issue: Access to accurate estimates of rainfall can improve our understanding of growing seasons or indicate where international agencies should provide aid.
- Solutions & Applications: Among other applications, rainfall and other Earth observation datasets are used to forecast tropical cyclones; monitor soil moisture conditions and freshwater availability; and monitor flood and drought conditions, landslide activity, crop yields, and water-related diseases.
4. Value of “Rain Gauge” data
Natural disasters are now becoming more extreme, abnormal, and irregular. Strong storms, super storms, heavy rains, widespread flooding, severe cold, landslides, etc. are occurring all over the world. This requires people to take remedial measures soon…
Practical example of applying rain gauge data
Rainfall data is important data in water resources management planning as well as disaster mitigation.
Disaster monitoring and forecasting
- Characterizing the surface and weather conditions that can lead to flooding is often difficult due to the lack of information available to monitor or forecast flood events (especially in developing countries like Vietnam).
- To fill some of these data gaps, scientists and forecasters often rely on satellite sources as inputs to hydrological models that can predict where water is likely to flow once it hits the ground.
- While most current flood models focus on local or regional scales (taking into account a drainage basin or watershed), some recent studies have turned to estimating flood potential areas on a global scale.
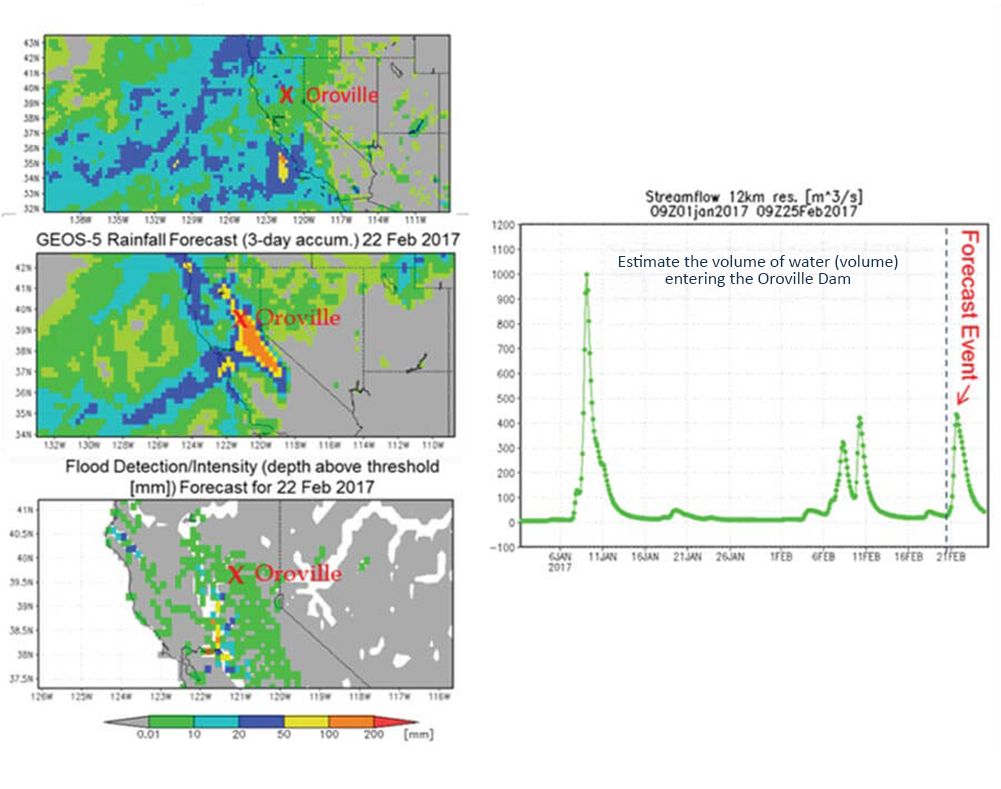
Example: Landslide Forecasting via the Global Flood Monitoring System (GFMS)
- The Global Flood Monitoring System (GFMS) is a NASA-funded experimental system that uses real-time satellite rainfall data as part of its flood monitoring and forecasting tools. The model combines satellite rainfall data with a hydrological model that includes information about soil types, soil moisture, vegetation, slope, rivers and streams, and other factors that influence whether an area is prone to flooding.
- The end product is a series of estimates describing potential flood conditions issued every three hours around the world. The data is accessible through the Global Flood Monitor. Starting with a 1/8 resolution map, users can “zoom in” to areas within the region, change which parameters to view, the time sequence of the map over the past few days or months, and select the latitude/longitude location and time sequence of the data plot at a point. Once sufficiently “zoomed in” (a latitude window of ~10° is recommended) on the 1/8 degree map, one can select from 1 km resolution parameters (streamflow, storage, flood maps) to get a high-resolution view of the regional catchment.
- This high-resolution time series of the map can be viewed and the time series at a point can also be plotted by clicking on that location. The global flood potential map can also be accessed via https://pmm.nasa.gov/precip-apps, where users can select a global flood layer in addition to cumulative rainfall from 30 minutes to 7 days.
Disease forecasting
- Malaria outbreaks following the 2010 floods in Pakistan; E. coli and coliform outbreaks from raw sewage in Mississippi floodwaters; and cholera spread by heavy rains in Cameroon, West Africa are among the many health hazards associated with natural disasters such as flooding and torrential rains.
- In developing regions with limited or vulnerable health infrastructure and resources, any improvement that increases the timeliness of warning systems can make a big difference in protecting the public. Using satellite data to predict disease outbreaks is an emerging field.
Example: Malaria risk assessment forecasting
NASA’s Global Malaria Modeling and Monitoring (GSAT) project combines data sets from multiple satellites, including rainfall estimates, to assess malaria risk worldwide. GPM’s near-global coverage and high-frequency observations also help identify areas at risk of public health crises from short-term events such as storm-induced flooding, which can cause health problems associated with wastewater and wastewater. For more information about this work, please visit: https://svs.gsfc.nasa.gov/30593.
Agricultural Forecast
- Famine Early Warning Network (FEWSNET): Remotely sensed rainfall estimates play a key role in monitoring and modeling efforts for organizations that monitor food and water security, such as the Famine Early Warning Systems Network (FEWSNET). In addition to the amount and distribution of seasonal rainfall, the timing of rainfall onset is an important variable for early estimates of growing season outcomes such as crop yields. With global coverage, satellites can also observe the results of natural disasters such as short- and long-term droughts, floods, persistent snow cover, or shortages that can impact agricultural productivity.
- Satellite Precipitation Estimates from GPM: Satellite precipitation estimates from GPM, combined with other environmental datasets, are used to determine the extent and availability of surface precipitation over farm and ranch lands in the U.S. Weather Service’s AGRMET Cultural Meteorology model (AGRMET).
- Use in hydrological models: AGRMET analyzes and forecasts rainfall and snowpack estimates for use in hydrological models. Data from NASA’s Soil Moisture Active Passive (SMAP) mission (and other satellite sensors) can provide additional information about soil water content, which is useful for assessing drought and flood conditions and estimating groundwater supplies.
Example: Improvements in crop monitoring and forecasting capabilities
- The International Production Assessment Division (IPAD) is the agricultural forecasting arm of the Office of Global Analysis (OGA) of the Foreign Agricultural Service (FAS) of the United States Department of Agriculture (USDA). IPAD is responsible for providing monthly global crop estimates and projected crop yields to monitor global crop conditions and ensure agricultural economic security. USDA FAS works with NASA and other satellite products to improve the agricultural yield forecasting system by providing NASA products, tools, and information.
- Through this effort, USDA FAS is implementing enhanced surface soil and root zone moisture products to improve performance in its crop forecasting system. Applying satellite-based soil moisture estimates from the Moisture of the Oceans (SMOS) mission to the FAS soil moisture model has resulted in significant improvements in vegetation forecast skill in several regions of the world, particularly those lacking the rain gauge coverage necessary to characterize the rainfall inputs to soil water balance models.
- Since going live in spring 2014, USDA FAS has demonstrated improvements in its crop monitoring and forecasting capabilities following the adoption of the new satellite-based product, particularly in sparsely populated states with moderate to severe food security issues. The system is currently being adapted to incorporate observations from NASA’s Crop Moisture Active Monitoring (SMAP) mission.
5. Introducing T3 Rain Gauge product solutions
The automatic tipping rain gauge station is designed in accordance with the guidelines of the World Meteorological Organization – WMO. With a sturdy design, it can withstand the diverse and harsh weather in Vietnam. A rain gauge station includes a measuring cup, a tipping bucket and a data-logger system that stores and transmits data to the automatic center.
WHO standard design & installation process
- Inlet diameter 200mm (8 inches)
- Steel column diameter (60mm)
- Stainless steel case
High precision
- Capable of tipping bucket alignment (Balance level is located inside the Alignment Base)
- Resolution 0.2mm
- Error complies with Circular 70/2015/TT-BTNMT: Technical regulations for the operation of Automatic Hydrological Gas Stations
Update data online
The cloud computing system ensures data continuity from rain gauge sensor data.
Use solar batteries
Choosing solar power ensures power supply for the rain gauge station for 03 months without the need for grid power.
To explore more detailed insights and applications, we invite you to discover additional application notes for other advanced devices and solutions.